DATA PLAYBOOK California Health and Human Services Agency
Planning your Data Project
Section 1: Planning for your Data Project
Table of Contents:
Part A. Determining Goals and Strategy
Part B. What Data you will Need
Part C. Where to Find the Data you Need
Taking the time to plan your project is essential. Whether you’re managing a team, analyzing or cleaning a portion the data, or drawing conclusions from your findings, completing any portion of the project requires a great deal of thought and planning. In the following section, we’ll provide a clear, step-by-step guide to the entire planning process, including everything you need to know about creating goals, determining a plan, and getting your data. It is our hope that you leave this section with a detailed and specific plan, and the confidence that you have the tools to carry out a successful project.
This section will:
- Help you identify the right questions and goals to guide your data collection process
- Describe what data you will need to successfully complete your project
- Provide helpful frameworks to jump-start your strategic planning process
| For Managers | For Analysts |
|---|---|
| - Setting KPIs and measuring performance | - Getting the data you need — list of Useful contacts |
| - Assessing your department’s data organization and data strategy | - All things public data |
| - Assessing Readiness and Resources | - Review of Data Sharing Agreement and Simplifying Interdepartmental Access to Data |
Part A: Determining Goals and Strategy
Step 1: Identify your Guiding Questions and Set your Goals
It is important to decide your vision and purpose behind your project, and identify what you hope your data project will accomplish. Be thoughtful — what impact do you hope to have? What changes are you trying to bring about? It is worth taking the time to write down your answers to the broader Guiding Questions, as they will be the foundation of your goals and strategic plan.
First, a bit about goals: for your project to execute smoothly, it is best to choose SMART Goals, of goals that are specific, measurable, achievable, realistic, and timely. Look at our summary of the SMART Goal checklist below:

| Hint: Goals often fall into one of the following categories: |
|---|
| - Increase something (e.g. increase healthy behaviors in a population) |
| - Make something (e.g. produce a mapping/visualization of all COVID-19 cases across California) |
| - Improve something (e.g. improve living conditions of a population) |
| - Reduce something (e.g. reduce number of smokers in California) |
Step 2: Develop a Strategic Plan
Now that you have identified your goals, you must develop a strategy for achieving your desired outcomes. A Strategic Plan is first and foremost a Roadmap to Success – the more care and thought you put into your plan, the more likely you are to produce a successful data project.
| Did you know? |
|---|
| CHHS has its own Strategic Plan that summarizes our vision and goals for every department’s products and services. While not a substitute for your strategic plan, it can give you ideas and and helps you ensure your strategy aligns with CHHS’ guiding principles and mission statement. |
Utilize a strategic planning framework such as the use case diagram or a logic model. These frameworks will help you explicitly define each step necessary to achieve your goals as well as anticipate what challenges you may face throughout your project.
Strategy Tip: Find the action words that best describe the work you’ll do:
Action words are verbs that describe how you will approach each task in this project. They don’t describe your intended outcome (i.e. increase and reduce are not action words); rather, they describe roles you will take throughout your project to assure a successful outcome.
If you are creating a product:
- Update, Upgrade, Develop, Create, Implement, Evaluate, Produce If you are managing a project:
- Oversee, coordinate, supervise, manage, plan, support, transition If you are implementing the specifics of a project:
- Write, process, provide, maintain, reconcile, direct, administer
 Example Use Case Diagram (lucidchart.com)
The Use Case Diagram
This framework is most helpful for projects where you intend to build some sort of system (e.g. website, smart phone app, etc.) that your users must interact with. You also must use a Business Use Case for any data you request using the Data Sharing Agreement form.
A Use Case Diagram will…
- Identify the goals of system-user interactions
- Define and organize functional requirements in your system
- Specify the context and requirements of a system
- Model the basic flow of events in a use case
Instructions for building a Use Case Diagram:
| Step 1: Start by defining your actors, or the users that interact with your system. they can be anything from a person to an organization or outside system that interacts with your product. Note: Think broadly – your users may include institutions both within and outside of CHHS as well as specific populations of the public |
| Step 2: For each user, list all the ways they can interact with your system (these are the “use cases”) Note: Ensure you consider alternate/undesirable courses of events and use cases that aren’t obvious |
| Step 3: Draw lines between use cases to reflect commonalities or relationships among them. Note: Identify the use case with the greatest number of relationships/associations – the most common use cases represent the functions in your project that should be essential. |
Also check out this Online resource to build your own Use Case Diagram.
The Logic Model
The logic model framework focuses on visualizing the relationship between inputs, outcomes, and costs associated with your project. It is a graphical model where each component (or “phase”) of your project relates to a list of intended effects in an implicit, ‘if-then’ way.

| The seven “components” you’ll consider are: |
|---|
| 1. Inputs: The resources you need for your project |
| 2. Activities: What the staff or the program does with those resources |
| 3. Outputs: Tangible products, capacities, or deliverables that result from the activities |
| 4. Outcomes: Changes that occur in other people or conditions because of the activities and outputs |
| 5. Impacts: The most distal/long-term outcomes |
| 6. Assumptions: Your beliefs about the program and the resources involved (including how successful you you think it will be or the challenges you may face) |
| 7. Moderators: Contextual factors that are out of control of the program but may help or hinder your efforts. These may influence participation, implementation, achievement of your outcomes. |
Example: e.g. If I hire more staff for my project (input), then I can collect more data about who would benefit from my service (activity). If we have more data, then our predictive model will be more accurate (output). If our model is more accurate, then we can increase outreach to populations who are more likely to benefit from our service (outcome) and so on.
To begin, simply create six headers as is shown in the diagram above — this can be done by hand, with sticky notes, or online.
Guiding Questions:
- Identifying Impact: What measurable change are you seeking to achieve in the long-term?
- Identifying Outcomes: What measurable changes are you seeking to achieve in the short-term?
- Identifying Outputs: What tangible outcomes can you measure immediately following the implementation of your product/project?
- Identifying Activities: What are some high-level steps you must take to complete your project?
List everything that comes to mind when you answer the those guiding questions above, drawing a box around each entry. Finally, draw arrows between boxes to signify the ‘if-then’ relationship.
 A Sample Logic Model from CDC.gov
Planning Part B: What Data You Will Need
With your goals and strategy successfully outlined, you can now think about what data or measurements you need to collect to answer your guiding questions, as well as the data you need to determine if you are ready to proceed with data collection. If you’re a manager, you’ll also need to define your outcome measures and performance/self-assessment metrics to maintain the integrity of your project and ensure you’re supporting your team and stakeholders as best you can.
For Analysts
Before proceeding, you should go through a Readiness Checklist to ensure you’ve considered your own strengths, weaknesses, and that of your manager and team. Get the support or learning you need now to prevent misunderstandings or frustrations later in the process.
Step 1: Readiness Checklist
Ask yourself: Do you have the Support, Knowledge, and Resources to Complete your Project?
| - Do my managers/directors have the bandwidth to support me? |
| - Do I/my team have enough expertise to complete this project? |
| - Who is my department’s Data Coordinator? (The individual responsible for knowing the data assets held by your department) - Contact CHHS@osi.ca.gov to find your Departments Data Coordinator |
| - Do I have access to the data I need to complete the project? |
| - Do I know the statistical methods required to analyze my data? |
Step 2: Review Your Program Data
Your program data is the core data of this project — it’s the specific measurements that you need to collect in order to answer the project’s guiding questions. As a review, your guiding questions are the purpose of this project as a whole, and spending some time thinking about your project’s purpose statements will help you determine what data you need and how you should collect it.
Example Purpose Statements:
- I need to decide how to allocate resources to different programs based on which is the most successful
- I want to improve or refine an existing program or model to be more effective
- I want to create product or service that positively impacts a community
- I want to look at existing data to find trends and patterns that people care about
It can be useful to review all your data assets with these questions in mind. Contact your department’s data coordinator for more information about the types of program data you collect in your department by emailing CHHS@osi.ca.gov.
For Managers:
Managing a team at CHHS is challenging — in addition to setting and working toward your own personal goals, you must also assess the performance of your team and support their continuing learning; set the broader goals that guide larger initiatives, programs, or departments; and work toward capacity building in analytics, data literacy/governance, and much more.
The following section is written for a wide range of manager roles, including the larger cohort of managers who supervise analysts and technical employees (SSM1s) to the smaller cohort of branch-level directors or managers working on capacity, vision, and strategy of their department.
Part 1: Assessing Capability
As a manager, you may be in charge of managing the overall performance and strategy of the project or program; you also may need to assess the performance of the team itself, and the department’s resources. This requires defining and measuring outcome data, monitoring your team’s or program’s performance, and assessing your department’s current data assets and analytic capabilities.
| The following section contains a number of frameworks and resources to assess your Team’s Capabilities… |
|---|
| …related to projects and programs |
| - Assessing Readiness: considering the scope, risks, limitations of your data project - Measuring Performance: Setting Key Performance Indicators (KPIs) for the project and your team - Determining outcome measures: benchmark, baseline, and comparative data |
| …at the department level |
| - Strategic Use of Data: how effectively does the department utilize data to inform decisions and strategy? - Capacity Building: Improving internal capacity, assessing management strategy & organization - Data Governance & Management: Management & Security of Data, Improving Data Literacy, data de-identification guidelines |
Managers of Projects and Programs: Assessing Readiness
Before planning your data collection, go through the following readiness checklist to ensure you are capable of successfully carrying out this data project. You should catalog your assets and resources regularly throughout your project to identify areas of weakness or gaps in resources.
The Readiness Checklist:
- How do programs or stakeholders use data currently? What do they do with it? How do they use it to make decisions or produce products for external stakeholders?
- What are limits to either the data or the implementation solution?
- What are the risks and issues with the current data? What value is not being realized?
- Identify the current workflow for collecting, processing, and publishing data. Are there dependencies to collecting, processing, and publishing the data?
Remember, if you do not have the resources you need, you and your team will likely encounter problems in your data project. Address weaknesses early and be on the lookout for areas you can improve throughout your project.
Measuring Performance and Outcome
This is the data you need to collect after deploying your product or service to determine whether or not it met your goals and was successful. A useful framework to reference is the Key Performance Indicators (KPIs) framework described here. KPIs measure your performance relative to your goals.
- Check out this resource to learn all about KPIs: what they are, why they work, and how to set them effectively.
Managers of Departments: Strategic Use of Data
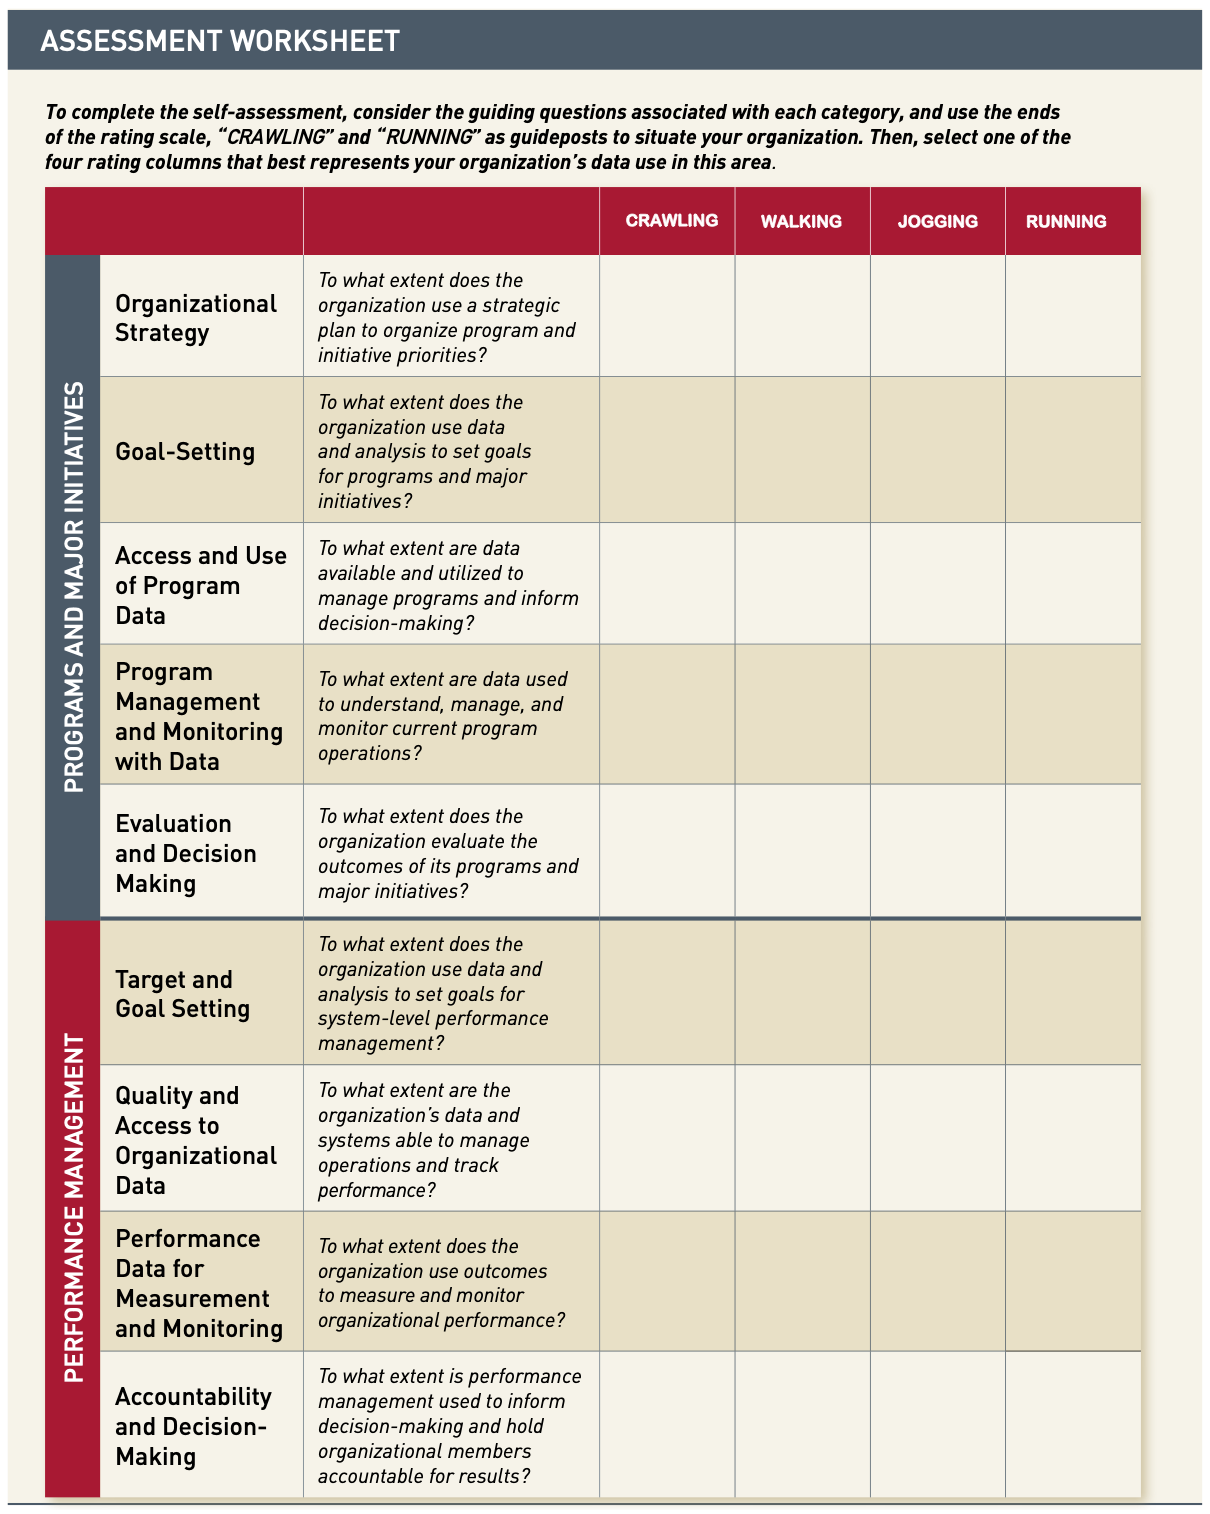
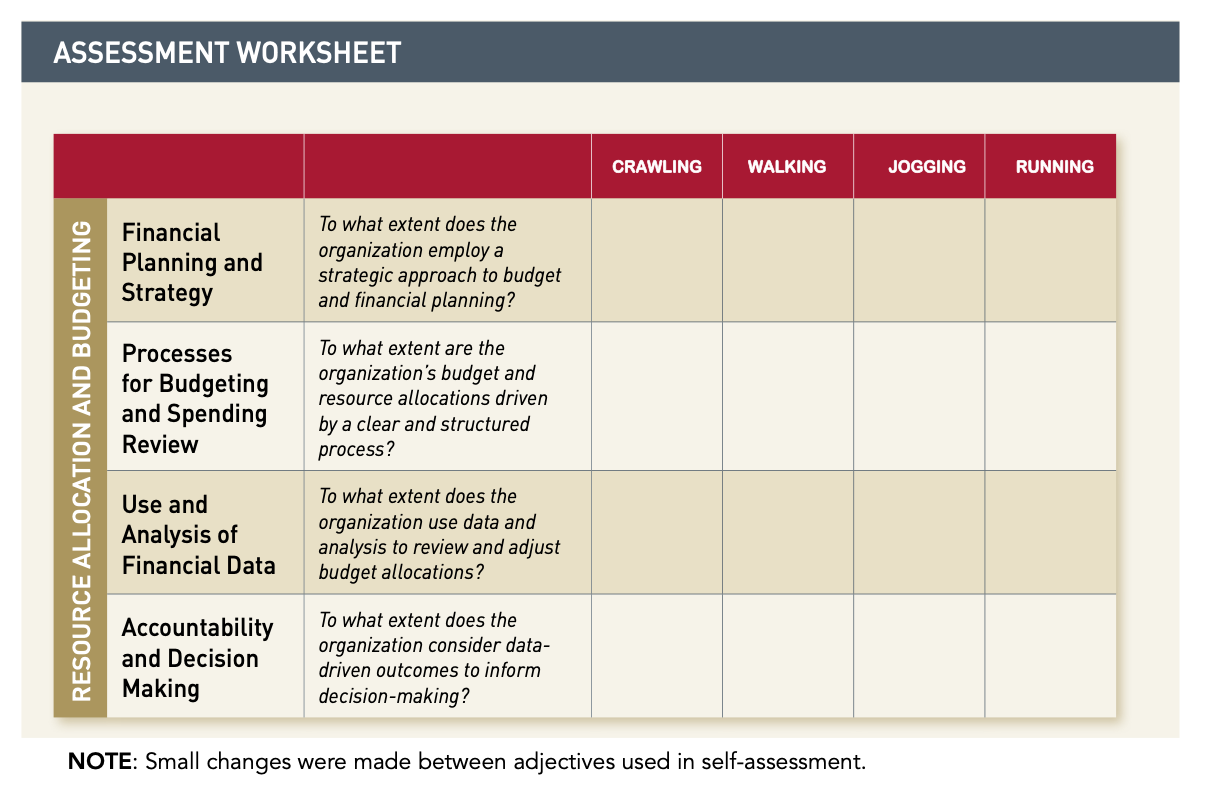
It is imperative for managers to regularly assess and improve how effectively they use their data assets to inform their strategic planning and organizational structure, as well as improve their offered programs and services. We will root our assessment in Harvard’s Strategic Use of Data Self-Assessment Guide, a useful framework for understanding how strategically your department uses data and how to improve. A few examples from the guide:
- Effective Budgeting and Financial Planning practices driven by data
- Assessing organizational strategy and goal-setting
- Measuring accountability at all levels of your team
Building Analytic Capacity
For managers interested in these types of assessments, check out additional resources on building Capability and Capacity in your department (such as the Analytics Capability Assessment for Human Service Agencies.
Note: For more concrete recommendations to build analytic capacity, check out this Roadmap to Capacity Building in Analytics. It will cover:
- All staff/Human Resource Needs for a successful team
- Executing a successful Program or Initiative
- How to integrate best practices in Data Governance
- Training Resource Topics to Provide to Analysts (Data Processing Methods)
You may also be tasked with assessing the quality of your department’s data management and data governance, or working on capacity-building frameworks to improve data literacy and analysis skills.
Harvard’s Strategic Use of Data Self-Assessment Guide has specific questions to identify where departments can better use data at the organizational and strategic level
 Harvard’s Strategic Use of Data Self-Assessment Guide has specific questions to identify where departments can better use data at the organizational and strategic level
Part C: Where to find your data
The final step of the planning process is also the most important and crucial to successful execution of your project: determining what data you need and where you will find it. This step can be time-consuming and frustrating, but the effort you put in will pay itself back ten-fold when you find yourself sitting down to start data analysis. Accurate, validated, and comprehensive data is the cornerstone to any data-driven initiative. It is critical to prioritize reliability and integrity of the data in order to ensure the legitimacy of your findings. In most data-driven companies, the “80/20 Rule” applies to data projects: 80% of your work will be spent finding, retrieving, cleaning, and organizing your data, and only 20% spent on actual data analysis. So don’t be surprised if this process seems daunting, and don’t rush through it. In this section, you’ll find information on accessing Internal Data (both within your department and in others) as well as External Data (data owned by some outside agency/organization, and typically publicly available). Use the Process Flow Chart on the following page to choose which resource — the Data Sharing Agreement, the Open Data Portal, your department’s stored data, or publicly available data— is appropriate for each of your data sources.
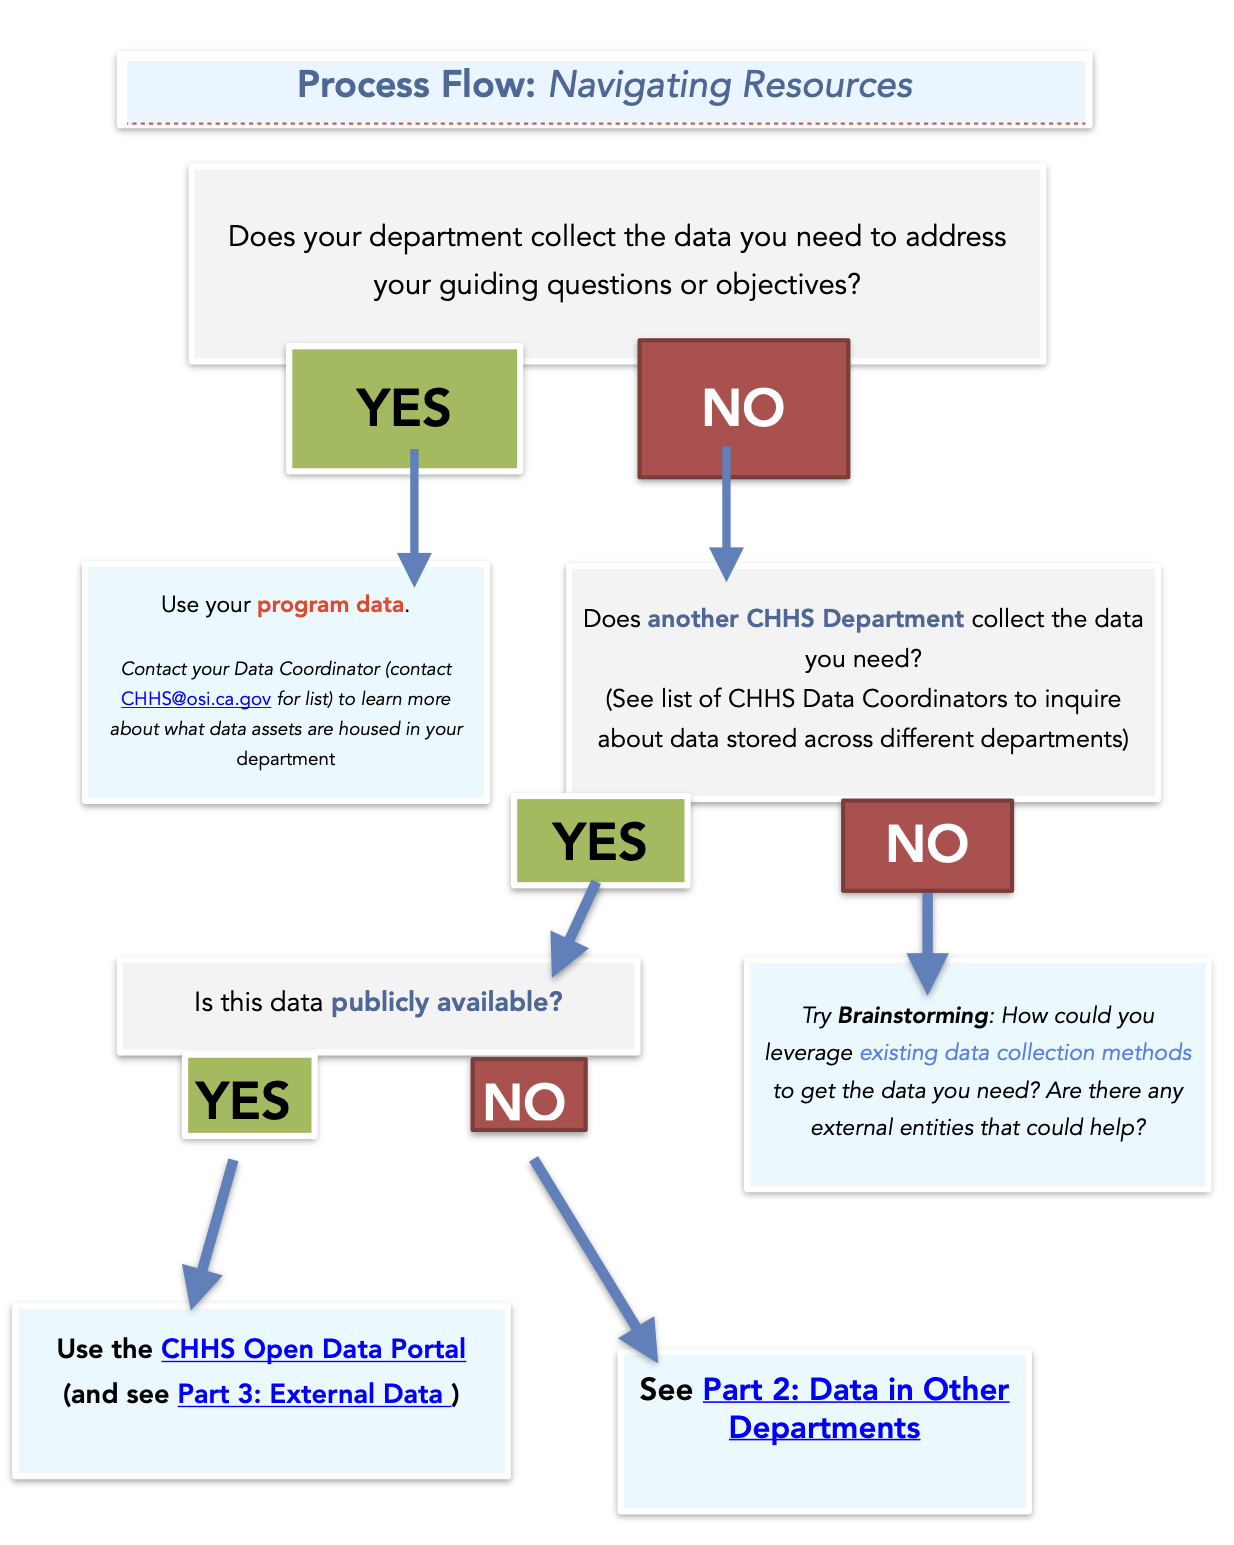
Option 1: Program Data
In most cases, you’ll be working with your Program Data — data that is owned by your department and collected by or for your program. This data resides within your department, and is easily accessible through your department’s Data Coordinator, who is your first resource to seek out when you need help thinking of what data to source for your project or where to find it. Please email CHHS@osi.ca.gov for help with contacting your department’s data coordinator.
Option 2: Data in Other Departments
In a few cases, you may find that your department does not have enough data for you to proceed with data analysis. To ensure you have a sufficient amount of data to being your analysis, you are encouraged to look to other departments’ data assets and determine if they’d be appropriate for your project.
Your first step to finding data in other departments is to check the CHHS Open Data Portal, our database for all CHHS data that is publicly-available.
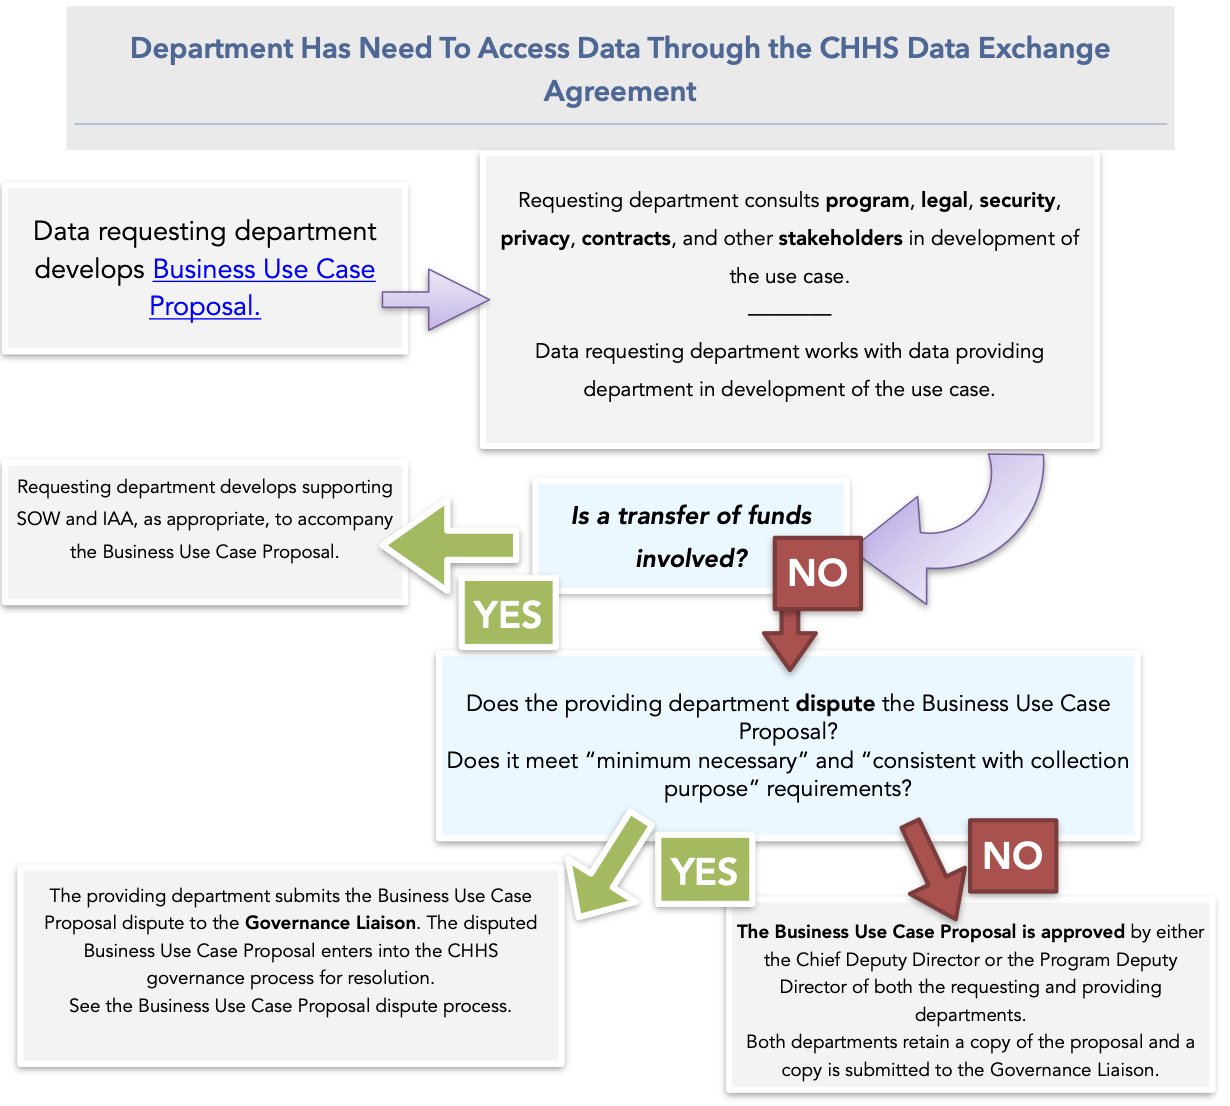
Data Sharing Agreement:
Accessing private data in other departments is dictated by the CHHS Data Sharing Agreement, a legal document that entitles any department to accessing another’s data assets through a Business Use Case Proposal. Only proceed with this section if you’ve (1) decided that some of the data you need is not already available through your department and (2) is NOT found on the Open Data Portal, then this is your next step.
Note: Read the Data De-Identification Guidelines (in Section 2, Part 1: Cleaning/De-Identifying your Dataset) before sharing any data from your department.
The goals of the Data Sharing Agreement are the following:
- Establish a legal framework for data initiatives
- Maximize appropriate sharing to increase positive outcomes and customer service
- Ensure privacy and security protections
- Reduce risk and use of duplicative resources
- Standardize data use agreements among CHHS Departments and offices
- Reduce contracting and data use agreement redundancies
- Track activity for better understanding of common data sharing needs between CHHS departments
To get data via the Data Sharing Agreement, you must contact your department’s Data Coordinator and submit a Business Use Case Proposal; this ensures proper documentation of what data you need, why you need it, and your commitment to several requirements, such as preserving the shared dataset in the form it was given to you. For more detailed instructions, visit the Business Use Case instructions or view the FAQ.
Option 3: Externally (Publicly-Available Data)
In the past decade, public interest in big data and data-driven projects has skyrocketed. As a result, there is a wealth of data available for free that may help you contextualize your results, find baseline measurements, or contribute to your findings. This section showcases some of our favorite sources of publicly available data.
- USAFacts.org — A data-driven portrait of the American population, our government’s finances, and government’s impact on society that uses federal, state, and local data from over 70 sources.
- datacatalogs.org — DataCatalogs.org aims to be the most comprehensive list of open data catalogs in the world. It is curated by a group of leading open data experts from around the world - including representatives from local, regional and national governments, international organizations such as the World Bank, and numerous NGOs.
- HealthData.gov — Dedicated to making high value health data more accessible to entrepreneurs, researchers, and policy makers in the hopes of better health outcomes for all.
- LOGD Dataset Catalog — The Linking Open Government Data (LOGD) project investigates opening and linking government data using Semantic web technologies. We are translating government-related datasets into RDF, linking them to the Web of Data and providing demos and tutorials on mashing up and consuming linked government data.
- CIA World Fact Book — Provides information on the history, people, government, economy, geography, communications, transportation, military, and transnational issues for 267 world entities.
- openFDA — Makes it easier to get access to publicly available FDA data. FDA’s goal is to make it simple for an application, mobile device, web developer, or researcher to use data from the FDA.
- Census Reporter — A Knight News Challenge-funded project to make it easier for journalists to write stories using information from the U.S. Census bureau. Place profiles and comparison pages provide a friendly interface for navigating data, including visualizations for a more useful first look.
- CalEnviro Screen — A mapping tool that helps identify California communities that are most affected by many sources of pollution, and where people are often especially vulnerable to pollution’s effects.
- California Healthy Places Index — A tool to explore community conditions that predict life expectancy. It contains user-friendly mapping and data resources at the census tract level across California.
- CHHS Open Data Portal — Offers access to standardized data that can be easily retrieved, combined, downloaded, sorted, searched, analyzed, redistributed and re-used by individuals, business, researchers, journalists, developers, and government to process, trend, and innovate.